

The Dose-Response Relationship
As a performance coach, I have always been curious as to the 'dose-response' of a training session. I understand that there are adaptations that will come from the cumulative stress encountered over time (GAS: General Adaptation Syndrome). But I also know that the level of intensity of that stress is relative to the interaction with that system at the specific time. The idea of dose-response relationship comes from pharmacology, and is described as:
"...the magnitude of the response of an organism, as a function of exposure to a stimulus or stressor after a certain exposure time."
I find this to be impactful, in the sense that our responses to stressors are relative to their magnitude or volume. Furthermore, since our systems are dynamic, the magnitude of the stimulus or stressor is relative to the system it is interacting with.
For example, we often dose medicine based on body mass because of the assumptions made of metabolism, blood volume, and dilution of that drug. Well, what if your body mass fluctuated daily? You would need to adjust the dosage to accommodate those changes.
I feel like this is relevant to training because we require energy and motor function to meet the prescribed demands of the training. Yes, we PRESCIRBE training to athletes. We decide a dose of specific stimulus (volume and intensity), in the hopes of reaching a desired level of stress. We assume that stress will, in effect, illicit an adaptation in response. But how do we know that they stimulus we are prescribing is going to result in the desired stress when we don't know the state of fatigue / readiness of the athlete on that given day?
I had sat on this thought for years until I was able to dive deeper into using force platforms and jump assessments. I was always looking for reliable methods to gauge an athlete's readiness and fatigue levels, and I found that the countermovement jump (CMJ) was a pivotal tool in this quest. This quick, yet seemingly simple, movement encapsulates a wealth of information about an athlete's lower body power and explosiveness. The simplicity allows me to use the test with almost any athlete and is powerful in that there is the variation found from test to test is reflective of performance and strategy of the athlete ( the exact thing I want to see).
The Countermovement Jump (CMJ)
The countermovement jump, a staple in performance assessments, serves as a litmus test for an athlete's ability to generate maximal force in a short timeframe. This jump involves a rapid descent into a partial squat followed by an explosive upward movement, utilizing the stretch-shortening cycle (a key mechanism in human movement that stores and releases elastic energy). The height attained during the jump and the speed of the entire movement reflect an athlete's lower body dynamic strength and power. I like to describe it as 'springy'. Like a strong spring, the more it is compressed, the more energy is being stored as resistance force. When released, the force will rapidly decompress the spring resulting in maximal velocity of its lengthening.
The rationale behind using the CMJ as a means of assessing readiness lies in its sensitivity to neuromuscular fatigue. The rapid, elastic nature of the movement makes it particularly responsive to the physiological and neurological changes that accompany fatigue. By assessing an athlete's performance in the CMJ, we gain some insights into the relationships between muscle contraction, neural activation, and the energy storage and release mechanisms—a holistic view that extends beyond traditional fatigue markers.
As athletes approach the threshold of overtraining or experience the cumulative effects of intensive training blocks, alterations in CMJ performance become indicative of their current physiological state. The CMJ, therefore, serves not only as a measure of physical capabilities but also as a biofeedback mechanism, offering valuable insights into whether an athlete is adequately prepared for the demands of training or competition.
The Reactive Strength Index
The Reactive Strength Index (RSI) and Modified Reactive Strength Index (RSI-mod) stand out as valuable metrics derived from the CMJ. These indices offer a nuanced understanding of an athlete's capacity to efficiently utilize elastic energy, providing insights not only into their power capabilities but also their readiness to perform.
The foundation of RSI lies in its simple calculation:
RSI = Flight Time / Ground Contact TimeSimply put, how high did the athlete jump, relative to how long it took them to get off the ground. This metric encapsulates an athlete's dynamic strength, where a higher RSI signifies a superior ability to convert ground contact time into significant jump height. It is important to note that RSI was originally investigated with the Drop Jump test. It is common for practitioners to use RSI with the CMJ by replacing 'Ground Contact Time' with 'Time to Takeoff'. But, in my opinion, it may be more advantageous to use the RSI-mod instead. As it was created specifically for the CMJ.
RSI-mod = Jump Height / Time to TakeoffThe primary difference with the RSI-mod is with the replacement of 'flight time' with jump height. And it is customary to use 'Time to Takeoff' (TtoT) instead of 'Ground Contact Time'. TtoT is the elapsed time from the start of the movement, until the point of takeoff. This is more specific to the process of the CMJ as it encompasses the specifics phases of the CMJ, allowing us to identify possibly changes in the jump movement/strategy. Where the jump height is specific to the performance outcome of the jump. The TtoT is representative of the jump strategy. Changes in TtoT, not only show the neuromuscular status of the athlete, but can also expose inhibitions or restrictions in certain patterns that effect the overall TtoT.
Quadrant System
For me, I found that I wanted more context when using this metric for assessing player readiness. Simply, I wanted to know how this athlete was today, compared to their norm. And was there a significant change from their normal variance. A common strategy for doing this, is to use z-scores. A z-score is calculated by subtracting the current value from the average of the data, and then dividing it by the standard deviation of that data. Essentially evaluating the distance this data point has from the average in reference to the normal variance of all the data. Simply, how far from normal is this occurrence in either direction.
Z-Score = ( point – average ) / standard deviationWhile this works perfectly for calculating the z-score for jump height. It can be confusing for TtoT because we have to consider the numerical value in reference to our interpretation of what has a positive or negative inference. Jumping higher is a better performance outcome, so a positive number is obviously better. But in the case of TtoT, jumping higher with a shorter time would be the positive outcome. So we adjust the formula so that a decrease in TtoT has a positive z-score and matches the inference we would make from the result.
TtoT Z-Score = ( average – point ) / standard deviationOne of the considerations that comes along with RSI, and RSI-mod, is the fact that they are ratios. Because we are evaluating the magnitude of the resultant, or changes in it, we should have an understanding that changes to either (or both) of its components will impact the resultant of the equation. At the same time, changes to both can result in no change to the resultant. For example, 2/1 is the same resultant as 4/2.
While we could use the z-score for the RSI-mod resultant, I felt like that was incomplete because I knew it was lacking context. We have 2 variables that can each move in 2 directions. Leaving me with a few possible outcomes:
Both around average
Both above average
One above average and the around average
One above average and the other below average
One below average and the around average
Both below average
While calculating this for multiple athletes is not very challenging, it can be difficult to evaluate the results and visualize them for quick decision making. I wanted a way to separate the athletes in to buckets of those who needed intervention vs those who didn’t, and what the intervention might be. Insert quadrants!
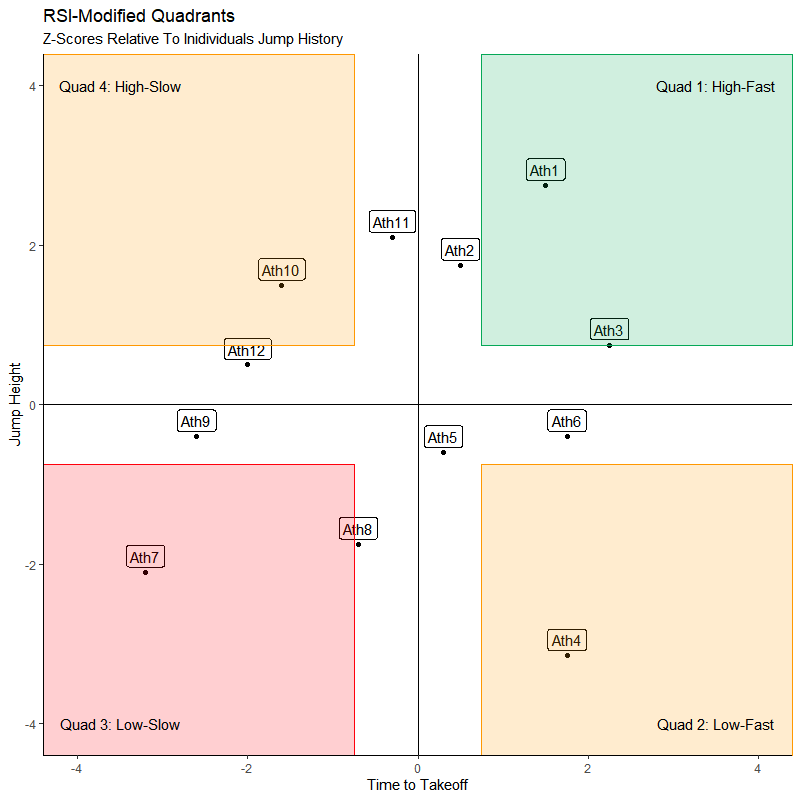
I found that using a simple scatter (coordinate) plot was the best way to see everything at once. Because a z-score will result in a simple positive or negative number between 4 and -4, both the jump height and TtoT are now on the same scale and can be plotted with the same distribution. For my own visual preference, I like to put jump height on the Y-Axis because I think of the jump going up and down. While I think TtoT as a matter of speed and faster along the track from left to right, so I put it on the X-Axis. This type of graph now gives us 4 distinct quadrants. Starting from the top-right and going clockwise:
Quadrant 1: Above Average Jump Height | Faster than Average Time to Takeoff
Quadrant 2: Below Average Jump Height | Faster than Average Time to Takeoff
Quadrant 3: Below Average Jump Height | Slow Than Average Time to Takeoff
Quadrant 4: Above Average Jump Height | Slow Than Average time to takeoff
Before getting in to detail with each quadrant, I want to take a step back to interpretation of the z-score values. I mentioned that one of the goals of this was to identify variance outside of the norm. Well, by definition, a z-score of -1 to +1 is within the normal variance for that result. But it should also be considered that these data points are expected to have variation, and the reason in which we do the test in the first place. With that said, you will see that I created a threshold of +\- 0.75 in my plot to allow for more sensitivity. I suggest that you investigate your data within your population to see which threshold would be most appropriate for your environment.
Quadrant 1: High-Fast
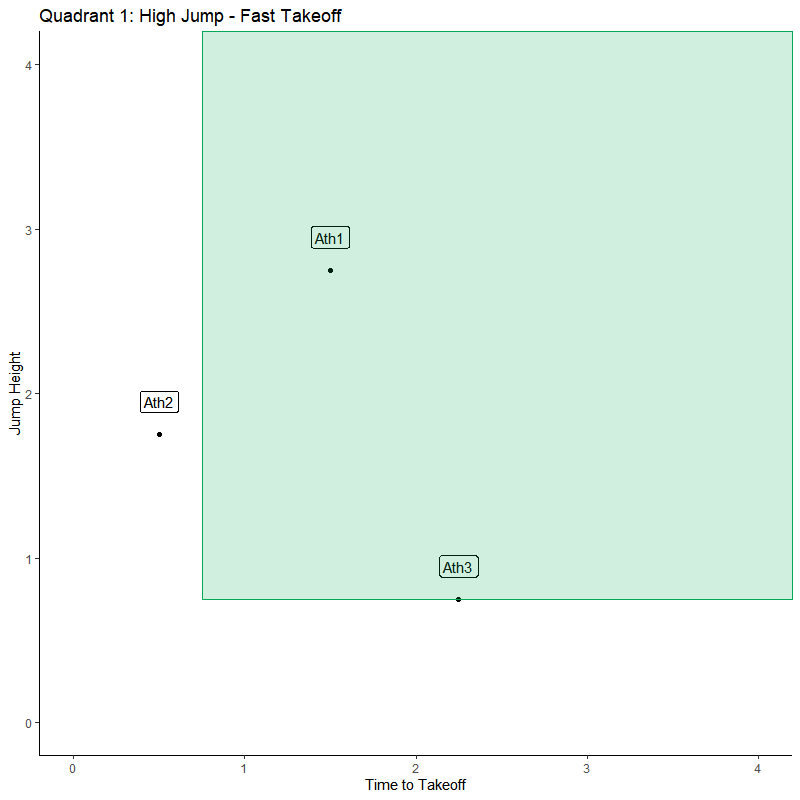
The takeaway from Q1 is that the athlete is overall performing better than average. This is the ideal result if we are looking for peak performance and readiness. These results indicate that the athlete is primed and giving outputs greater than normal.
Monitoring: High readiness and fit to go
Training: Normal training prescription or even push the intensity/volume to take advantage of increased capacity.
Quadrant 2: Low-Fast
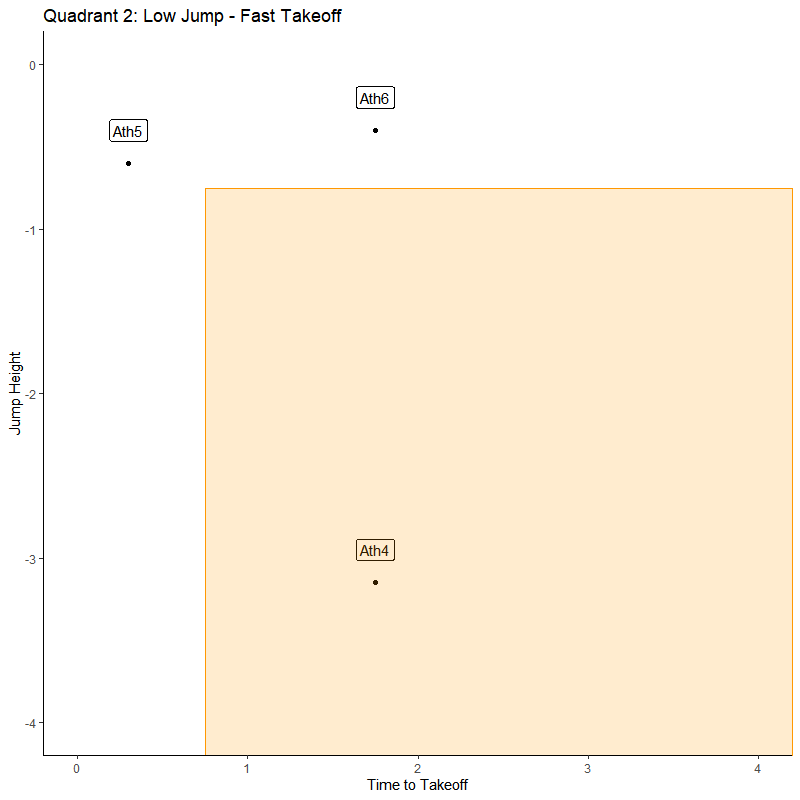
Q2 is interesting in that we would assume that the athlete is showing signs of neuromuscular readiness because they are moving fast, but the jump height does not indicate that. In my experience, we see the faster, or shorter, TtoT because the athlete has abbreviated their countermovement depth. The athlete can be guarded from large ranges of motion at certain joints or protecting from lengthening of sore muscle groups.
Monitoring: Lower readiness, possible soft tissue / mobility interventions
Training: Adjusted training program with likely decrease in intensity and volume. Or increase in preparation or exercises focused on range of motion and mobility
Quadrant 3: Low-Slow
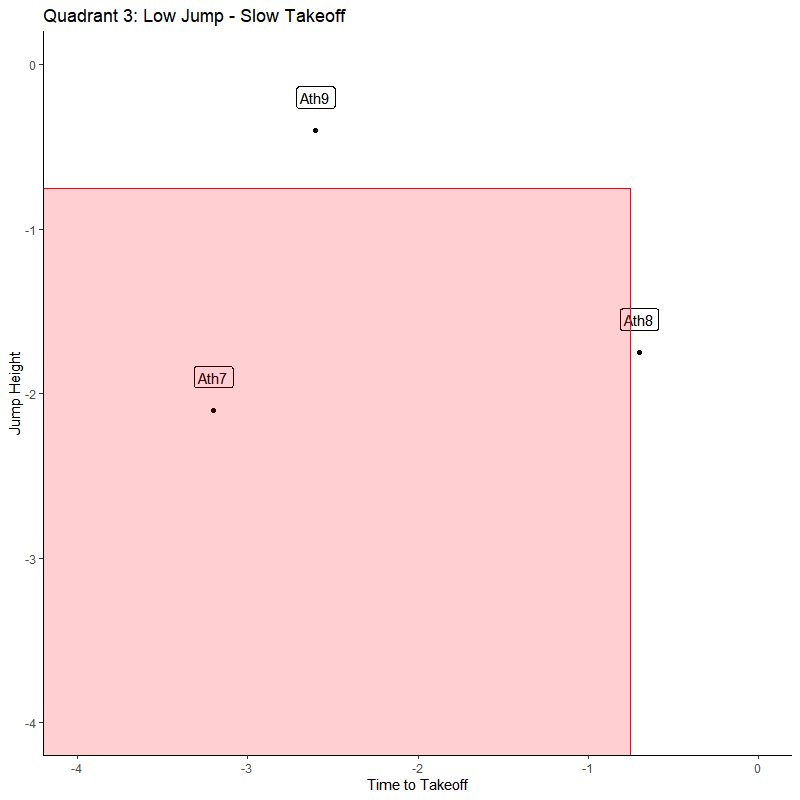
Q3 is the bottom of the barrel. It is the quadrant that is easiest to interpret, along with Q1. This area shows significant decrement in both outcomes and suggests the athlete is not near normal performance.
Monitoring: Low readiness and significant fatigue
Training: Decrease in training volume/intensity, prioritize recovery methods. Higher risk of over-training
Quadrant 4: High-Slow
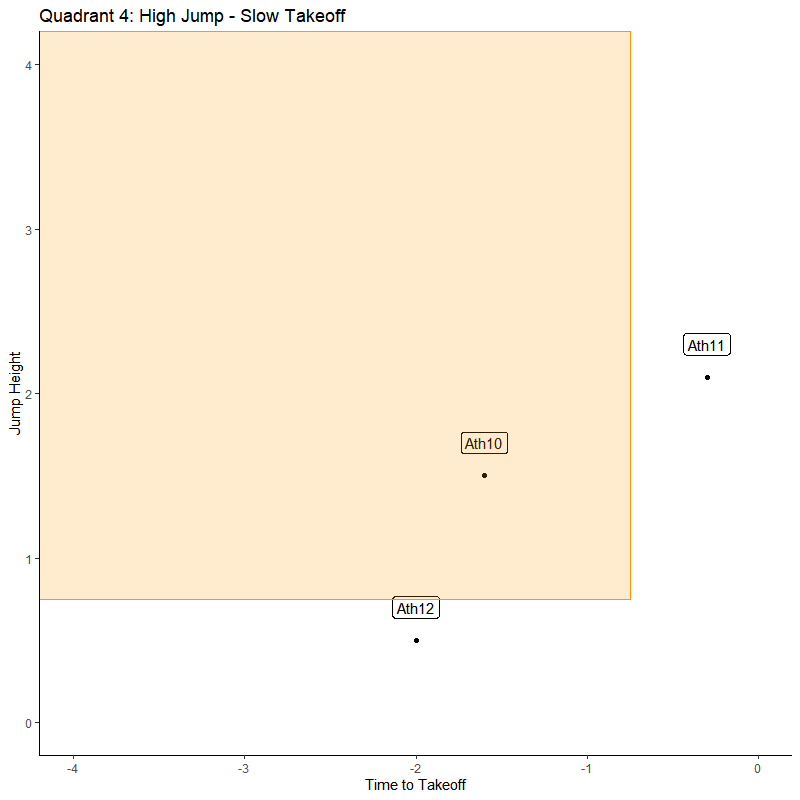
Q4 is like Q2, in that it has a convergence of the variables. The athlete is jumping higher but doing so in more time. This is the traditional expression of what we look for with fatigue and lack of readiness with neuromuscular function. The system can produce similar forces and reach normal to above average jump height, but it took more time and work to get there. This is usually a sign of lower rate of force development, or a change in jump strategy that incorporated greater ranges of motion to allow more time/distance for force to be applied.
Monitoring: Lower readiness, possible neuromuscular fatigue
Training: Possible change to training intensity, focus on potentiation and neural activation prior to training.
Conclusion
Like any other input, this plot alone does not drive all my training decisions. I take these findings into consideration with other data points and intuitions, to give me the best information to make the decisions I need with my athletes. But, for me, this gave me insight into the questions I had about the appropriate dosage for that given day. I found some objective evidence to see the athlete in a comparable scenario and get a simple gauge of their performance on that day. Overall, this should be the goal for each practitioner. Prescribe the appropriate dosage for the correct stimulus, to get the desired adaptation.
Comments