

In my previous post on using a dynamic training approach, we talked about the significance of understanding an athlete's readiness and the intricacies of dose-response relationships. Furthermore, I mentioned how the Countermovement Jump (CMJ) could be a great approach for many; offering my thoughts as to how an athlete's lower body power and explosiveness can give insight into their daily readiness to train or compete. In this post, I’ll elaborate more by presenting a case study involving 4751 NCAA Division 1 Men's Basketball (MBB) CMJ jump trials. This case study aims to give further understanding into my thoughts and rationale for how I would assess changes and variations in performance, utilizing the Modified Reactive Strength Index (mRSI) and a Quadrant System for a nuanced evaluation.
Reflecting on mRSI and Quadrants
Before delving into the case study, let's briefly revisit the concepts of the Modified Reactive Strength Index (mRSI) and why I like to view its components through the lens of a ‘Quadrant System’. In our previous discussion, we highlighted how the CMJ (specifically its RSI / mRSI), provides a holistic view of an athlete's neuromuscular status and readiness. It’s a very simple concept. Jumping, as in the CMJ, is a noninvasive and repeatable task that I can ask the athlete to do at any given time. And I can easily compare jumps from different time periods by analyzing the different metrics of the jump. I like to use a framework to organize and conceptualize the jump metrics, called ODS. You can read more about this in a great blog from our team at Hawkin Dynamics.
Some metrics, like Jump Height (JH), are viewed as Outcome metrics. Outcomes tell us the quality of the jump performance, or the results. In a very plain sense, we asked them to jump as high as they can. So, the clearest outcome must be the JH. But there are other scenarios where another outcome metric, like Relative Mean Power, might be more appropriate for your analysis.
Then there are Drivers. These metrics are to the CMJ, as horsepower is to a car. They describe the kinetic measures at play. Things like Propulsive Impulse and Average Force, describe the variables that went into the Outcome calculations, and what energy was being distributed or transferred during the movement.
While other metrics, like Time to Takeoff (TtoT) and Countermovement Depth (CD), are viewed as Strategy metrics. They give us insight as to how the athlete executed the task of jumping. How long did they spend in the different phases of the jump? Where did they prioritize their force production? Or even, did they alter their normal time and distance constraints to accomplish the jump?
In this sense, when using the CMJ for assessing readiness, mRSI is a logical value to measure. As it gives us two of our three metric categories in one expression. We can see the outcome of the jump and the strategy of the jump to see if the athlete is under, or over, performing from their norm. But there is an issue, in that mRSI is a ratio. So, we aren’t really sure what to attribute the change to. And if we can’t identify how the value changed, then how can we make changes to our interventions. That’ where the quadrant comes in.
With the Quadrant System approach, we take the two metrics that comprise mRSI (JH and TtoT), normalize the values against the athlete’s average, then visualize them with a scatter plot. This allows us to see which of the metrics, or the magnitude of either, is affecting the resulting mRSI. But mRSI, as I will explain later, might be an unnecessary calculation when using the quadrants. Let’s dig into this case study and have a closer look at what the quadrants tell us.
Case Study: NCAA Div. 1 MBB Countermovement Jump
For this case study, I was able to put together an extensive dataset comprised of 4751 jump trials from NCAA Div 1 Men's Basketball players. The objective was to assess how changes in mRSI could be analyzed through the Quadrant System, and shedding light on what its deconstructed components give us without the use of a ratio. To do this, we are only going to focus on a few of the metrics: Modified Reactive Strength Index (mRSI), Jump Height (JH), Time to Takeoff (TtoT), and Countermovement Depth (CD). Obviously, the mRSI value is the metric in question and we want to discuss what normal variation looks like for this value across a large dataset. But also, since we want to find more context within the mRSI, we should investigate how the Outcome and Strategy measures are represented as well. Lastly, I feel it’s very valuable to include CD in the discussion because it’s a demonstrable way to measure change in jump strategy. I often explain mRSI as a way to measure how ‘springy’ an athlete is. How high can they jump, versus how fast they can jump. Well speed is a matter of distance over time (d/t). So, we should probably add the CD to the context, along with TtoT, so we ca have an idea of how ‘fast’ the athlete was jumping.
mRSI
One of the more commonly used strategies for assessing readiness is to measure a values distance from the norm. In this case, we are specifically talking about identifying if an athlete’s mRSI is outside of its normal variance. Through the rest of the post, I will reference this as a ‘flag’ or ‘flagging’. This means that a trial or metric was outside of its threshold for normal variance. To be clear, for this analysis I used a threshold of 30% of standard deviation, or 0.3 x standard deviation. Some of you may be familiar with Will Hopkins’ ‘Smallest Worthwhile Change’, and its value of 20% of standard deviation. But I find this to be too sensitive in my experience, as it is meant to only show a trivial level of change. I settled on 30% as it gives a slightly higher level of significance to the value’s outside of the threshold.

To evaluate the number of flags in this data set, we grouped each of the trials by athlete to find the average mRSI for each athlete and their standard deviation. Then we created an individual z-score for each jump’s mRSI by subtracting that trials mRSI from the average mRSI for that athlete, then dividing that result by the standard deviation for their mRSI values. This means, if a trail’s mRSI was equal to the athlete’s average, the resulting z-score would be 0. And an above average jump would be positive, and below average negative. Based on the thresholds we set, a z-score greater than 0.3 or less than -0.3 would be a flagged jump. In practice of using mRSI for assessing readiness, these jumps might signal a call to a possible intervention.
So, how many flags were there? Well, of the 4,751 jump trials, there were 3,694 jumps that met the flag criteria. That is a large majority of the jump at 78%. This shows that using this kind of small threshold with a value like mRSI is far too sensitive and probably wouldn’t lend us the information we need. This is also to be expected with the general idea of distribution measures. The lower I make my threshold; the more data points will be included. As you can imagine, if I increase my threshold to +/- 0.5, I find 62% flags. And if I increase my threshold to a full standard deviation, I will only see 32% flags. This isn’t a good or bad thing, in the sense that I am evaluating a ratio. Again, it is hard to tell what is even happening just from a fluctuation in this single metric.
The Quadrants vs mRSI
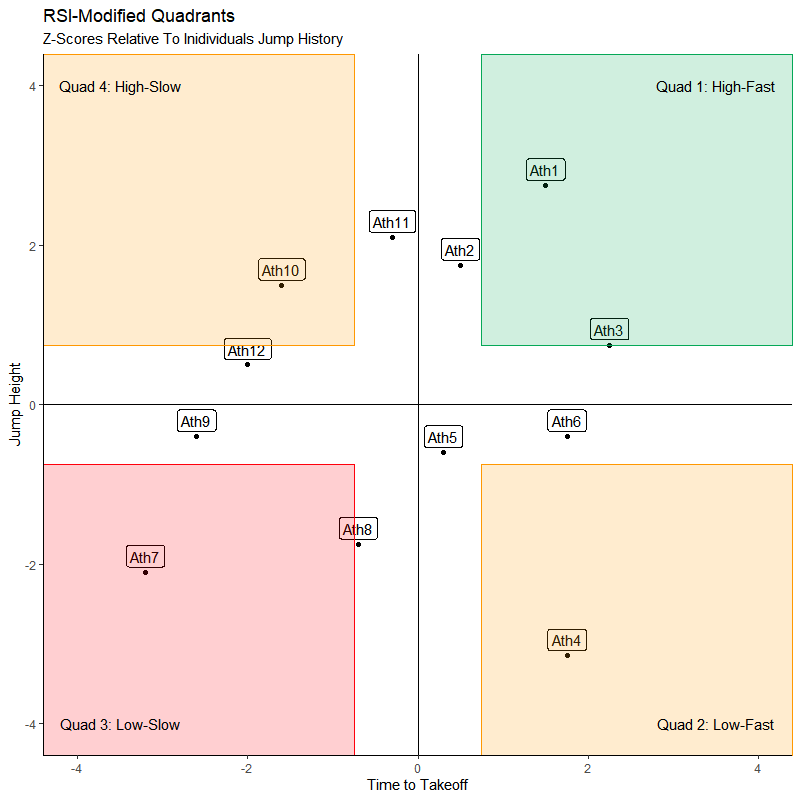
To take it one step further, let’s go ahead and classify the jump trials by their quadrant. As I explained in the last post, we will do the same relative z-score process with each of the mRSI metrics (JH and TtoT). The z-score value of the JH is interpreted on the y-axis, and the value of the TtoT is on the x-axis. This gives our quadrants of:
Quadrant 1 = +JH , +TtoT
Quadrant 2 = -JH , +TtoT
Quadrant 3 = -JH , -TtoT
Quadrant 4 = +JH , -TtoT
Just like our mRSI, we want to create an individual threshold for these metrics to flag for some sort of significant change from the norm. We will go back to the 30% that we mentioned earlier. This means that to qualify as a Q1 jump, the JH and TtoT z-scores both need to be greater than 0.3. This obviously means that there will be trials that do not fall into any of the quadrants, and I will refer to those as norms.

So now you might be asking, “how many of the jumps are in each quadrant?” Good question! About 45% of the jumps did not fall into a quadrant. While there were 18% in Q1, 14% in Q2, 12% in Q3, and 11% in Q4. What was interesting to me is that only 30% of all jumps were represented in a quadrant that had both metrics meeting positive or negative significant change. Meaning that 25% of all jumps were in a quadrant comprised of one metric showing positive change while the other showing negative change. And when we think about mRSI being a ratio, our result might not flag because the two inputs balanced out to a normal range despite both being out of their normal variance. Specifically, when we account for which trials flagged by means of mRSI threshold; almost 18% of all jumps that showed significant change (met quadrant criteria) did not flag. That means that out of all the trials, 10% them should have flagged for significant change with regards to the quadrants but were missed when only considering mRSI.
Quadrant Talk

Now we should take a deeper look at the differences between the quadrants. Afterall, the goal of using quadrants instead of mRSI alone is to find a greater level of understanding of athlete readiness and possible underlying reasons for changes in their readiness. The previous post discussed how I interpreted the need for different interventions dependent on the quadrant the trial fell into. And I think there are a few insights we can pull from this case study that give support to these ideas.
Norms

Earlier, I mentioned that around 45% of the jumps did not fit into any of the quadrant criteria. Interestingly enough, when we evaluate the jumps in the norms category for mRSI flags like we did the quadrants, we find that 73% of those jumps would have flagged. To go one step further, roughly 70% of that 73% would have flagged for significant change in one of the two metrics but did not show significant change for both. While this would be an issue if we only considered the quadrant components without mRSI; it gives credence to using mRSI as a first layer of analysis. As we see, the majority of jumps that were significantly higher / lower, or faster / slower would have been flagged by mRSI alone. This is representative of the standard usage of mRSI as a catch all.
Quadrants 1 & 3

Like the findings from the norms category, Q1 and Q3 aligned with the mRSI flags. Actually, 100% of the jumps in these quadrants would have flagged via mRSI analysis alone. This makes logical sense as these jumps showed significant change for both metrics in either a positive or negative direction. Again, these are the exact types of jumps that using mRSI as a stand-alone metric is meant to account for.
Quadrants 2 & 4
The real power of the quadrants comes to life when analyzing Q2 and Q4. As I mentioned earlier, 10% of all trials were almost equally distributed between these two quadrants and not flagged by mRSI threshold alone. Meaning that, despite the components each having significant changes, their opposing directions resulted in a ratio that was equal to the normal mRSI. This highlights the use of quadrants to identify these jumps where the ratio was not sensitive enough to show change.

Further investigation into these quadrants shows more details about their differences from each other and the rest of the categories. As both of these quadrants have a metric above average and the other below average, they tell two different stories. In particular, Q4 is a story of change in output. When running a correlation analysis for these metrics, 70% of change in mRSI can be attributed to TtoT. This is along with 60% attributed to JH and 30% to CD. While I mentioned earlier that we could think of TtoT as a strategy metric, we should keep CD in mind. If you run the same correlation analysis on each quadrant, then it becomes apparent that there is very little, to no impact of CD on Quad 4 jumps. Actually, only 3% of mRSI variation is attributed to CD, while almost 75% can be attributed to TtoT. This means that there is large differences in TtoT with very little variation in CD. The athletes are taking longer to move across the same distances, and thus moving slower. This is why I view this as an output reduction, as the athletes are trying to accomplish the same strategy but are needing more time to adequately create the forces needed to achieve the output.
When it comes to Q2, we see the opposite issue. It becomes clear that the athletes are changing strategy in these trials. As the correlation values are far different for Q2 than any other quadrant. In an analysis of Q2, 50% of mRSI variation can be attributed to JH. With only 40% being attributed to TtoT. The real difference can be seen with CD. In all other quadrants, CD accounts for 10% of variation in JH, whereas in Q2, it accounts for 45% of JH variation. Along with that, CD also accounts for 45% of variation in TtoT. Showing that CD is a large reason for why these trials were categorized as Q2. It is safe to assume that the jumps in Q2 had abbreviated CD which allowed for the TtoT to be significantly shorter and led to significantly lower JH.
Wrapping Up
In conclusion, our case study provided valuable insights into the dynamics of the mRSI, emphasizing the importance of a nuanced approach to using this metric for readiness assessment with the CMJ. The Quadrant System, coupled with mRSI, offers a practical and visually intuitive tool for coaches and practitioners to make informed decisions in training prescription. As we continue to refine our understanding of dynamic training, the integration of real-world case studies adds depth to our knowledge, empowering coaches to tailor their approaches to each athlete's unique needs and responses.
Comments